We pay for the servers and plans we use. Links marked as affiliate links earn us a commission at no cost to you; it never changes what we recommend. Details.
You log in to a small server to see how much memory is left, and every tool gives a different answer. We ran the usual ones on our 1 GB test server within a minute of each other and wrote down what each said.
Measured 8 Oct 2026, 05:15 UTC, over SSH on our test droplet
coolify-test(DigitalOcean FRA1, $6 Basic, 1 vCPU, 1 GB RAM, Ubuntu 24.04.5, kernel 6.8, Docker 29.8.2), up 6 days 15 hours. Twelve containers: Coolify 4.3.23 and its services, n8n 2.10.2 with Postgres, Uptime Kuma 2, a small Node app. Commands:free -m,/proc/meminfo,docker stats --no-stream, each container's cgroupmemory.current,memory.swap.currentandmemory.stat, every process's/proc/<pid>/smaps_rollup, andvmstat 1 5.
The four answers, one minute apart
| Tool | What it said | What it counts |
|---|---|---|
free -m, used | 769 MB of 961 MB | All RAM that is not free and not cache the kernel can reclaim |
free -m, available | 192 MB | What new programs can still get without swapping, by the kernel's own estimate |
free -m, swap used | 972 MB of 2,047 MB | Pages pushed out of RAM to the swap file |
docker stats, all 12 containers added up | 343 MiB | Each container's RAM minus its inactive file cache; no swap |
ps / smaps_rollup, RSS of every process added up | 904 MB | RAM pages each process can see, shared pages counted again for every process that maps them |
smaps_rollup, PSS of every process added up | 531 MB | The same pages, with each shared page split between the processes sharing it |
Nothing here is wrong. Each line answers a different question, and the gaps between them are where people misread a server.
Why docker stats looks so small
docker stats takes the container's cgroup memory and subtracts the inactive file cache. For Coolify's main container the cgroup said 164 MB in use with 12 MB of inactive cache, and docker stats showed 152 MiB: the same number with the cache taken off.
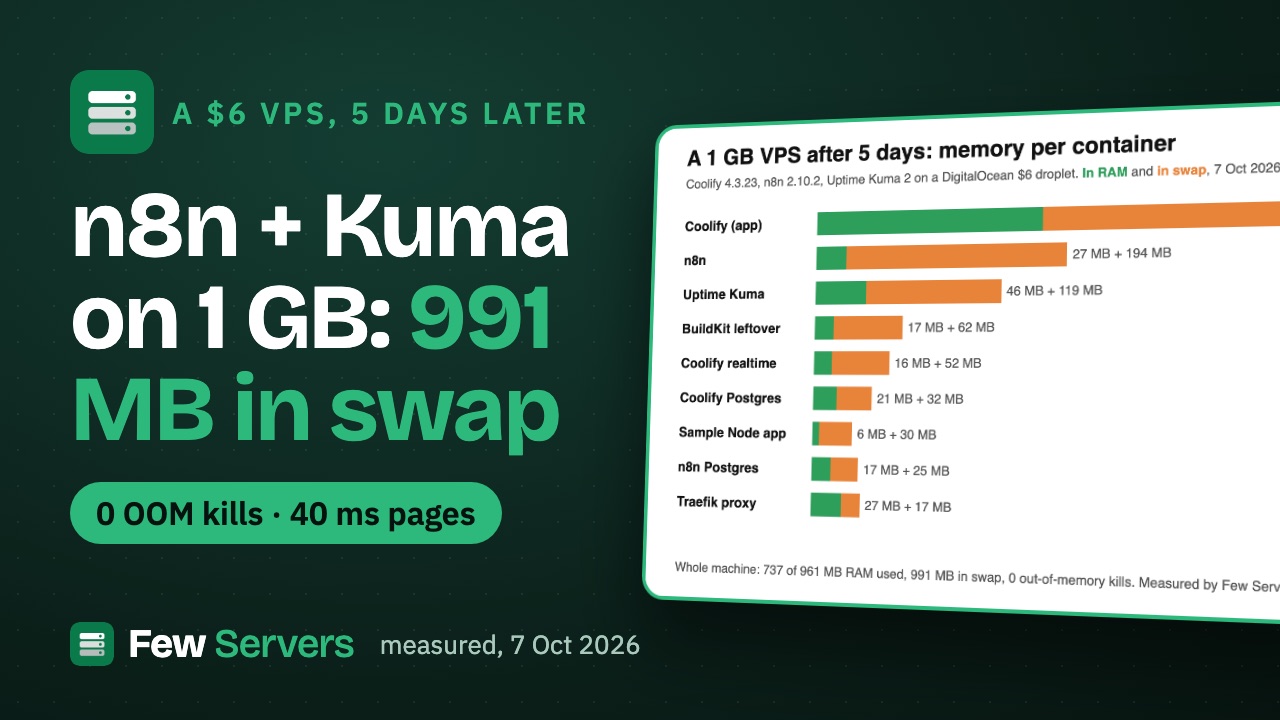
What it never shows is swap. On a box that swaps, that is most of the picture (the cgroup files were read 17 seconds after docker stats, so small differences between the first two columns are memory moving in between):
| Container | docker stats | In RAM (cgroup) | In swap (cgroup) |
|---|---|---|---|
| Coolify (app) | 152 MiB | 164 MB | 242 MB |
| n8n | 24.6 MiB | 29 MB | 195 MB |
| Uptime Kuma | 45.6 MiB | 47 MB | 110 MB |
| BuildKit (left over from a build) | 36.9 MiB | 19 MB | 62 MB |
| Coolify realtime | 17.1 MiB | 18 MB | 51 MB |
| Coolify Postgres | 19.0 MiB | 26 MB | 30 MB |
| Sample Node app | 5.5 MiB | 10 MB | 29 MB |
| n8n Postgres | 13.2 MiB | 17 MB | 26 MB |
Judged by docker stats, n8n is a 25 MB app. Counting its swap, it is about 220 MB, nine times more. If you size a server from docker stats on a machine that is already swapping, you will undersize it.
To read both numbers for one container on Ubuntu 24.04 (cgroup v2), use the full container id:
id=$(docker inspect -f '{{.Id}}' n8n-container-name)
cat /sys/fs/cgroup/system.slice/docker-$id.scope/memory.current       # bytes in RAM
cat /sys/fs/cgroup/system.slice/docker-$id.scope/memory.swap.current  # bytes in swap
Why adding up ps gives too much
RSS is every page a process has in RAM, including pages it shares with others: libraries, and memory a parent process shares with its workers. Coolify runs PHP-FPM workers, and each one reported about 25-28 MB of RSS, but only 4.6-6.3 MB of PSS, its fair share once the shared pages are split. Add up the RSS of several such workers and you count the same shared memory once for each of them.
Across the whole machine, RSS added up to 904 MB and PSS to 531 MB. PSS is the better number for "how much does this group of processes cost"; RSS is the right number only for a single process on its own.
Per-process swap has the same trap. The Swap: lines in smaps_rollup added up to 1,583 MB, while the machine only had 972 MB in swap. Shared pages that were swapped out show up in every process that maps them. The biggest single entries were still useful for ranking: n8n's Node.js process (it appears as MainThread) with 187 MB, then uptime-kuma with 100 MB. Use per-process numbers to find the biggest users, not to add up a total.
Why free's used is not the number to watch
free called 769 MB used and 69 MB free, which looks alarming on a 961 MB machine. Linux keeps file cache in RAM until something needs the space, so free memory on a busy server is always low. The kernel's own estimate of what is still usable, MemAvailable, was 192 MB, and that is what free prints as available.
The swap line matters more on a small box: 972 MB of pages did not fit in RAM. vmstat 1 5 showed the kernel reading up to 180 KB per second back from swap in the one-second samples (0, 152, 128 and 180 KB/s; the first line, 464 KB/s, is the average since boot). Swap that sits still is harmless; swap that is read back all the time means the working set does not fit.
Which number to use for what
- Am I about to run out?
free -m: the available column, then the swap line. Low available plus a busysicolumn invmstat 5means it is time for more RAM. - Which container is the problem? The cgroup files above, RAM plus swap.
docker statsalone hides swap. - Which process is the problem? Per-process RSS or swap, to rank them. Do not add them up.
- What does a group of processes really cost? PSS, from
/proc/<pid>/smaps_rollup.
The commands for the swap ranking are on our one-page checklist: find what is using memory and swap.
What this box should be
This is the same server we watched for 5 days with Coolify, n8n and Uptime Kuma. Six days in, it still runs, with about 1.7 GB of demand on 1 GB of RAM. The numbers above are why we would not judge it from docker stats: that view says 343 MiB and suggests plenty of room, while the machine is a gigabyte into swap.
If you are choosing a size for a similar stack, prices read on 7 Oct 2026: a DigitalOcean Basic droplet with 2 GB is $12 a month and 4 GB is $24; Database Mart's Express Linux VPS has 4 GB for $5.99 with a shared IP address and US data centres only (details in Database Mart VPS pricing explained). We measured only the 1 GB droplet in this article.
FAQ
Why does docker stats show less memory than free?
docker stats leaves out swap and subtracts the cache the kernel can drop, and it only covers containers, not Docker itself, the system services or the kernel. On our server the 12 containers added up to 343 MiB in docker stats while free said 769 MB used and 972 MB in swap.
Does docker stats include swap?
No. On our server n8n showed 24.6 MiB in docker stats and had 195 MB in swap at the same moment, according to its cgroup's memory.swap.current.
What is the difference between RSS and PSS?
RSS counts every page a process has in RAM, including pages shared with other processes. PSS splits each shared page between the processes that share it. Our PHP-FPM workers had about 25 MB of RSS each but 5 MB of PSS. Adding up RSS over-counts; adding up PSS does not.
Which free column should I watch?
available. It is the kernel's estimate of memory that new programs can use without swapping. free is always low on a busy server because Linux fills spare RAM with cache.
Why do the per-process swap numbers add up to more than the swap in use?
Swapped-out shared pages are reported by every process that maps them. Ours added up to 1,583 MB with only 972 MB of swap in use. Use the per-process numbers to rank, and free for the total.
Used in this article
- DigitalOceanThe $6 Basic droplet (1 vCPU, 1 GB RAM, 25 GB SSD) our test server runs on.Visit DigitalOcean
- Database MartVPS, dedicated and GPU servers. Affiliate link (Awin).Visit Database Mart
Affiliate link: we may earn a commission if you sign up, at no cost to you. Details.